
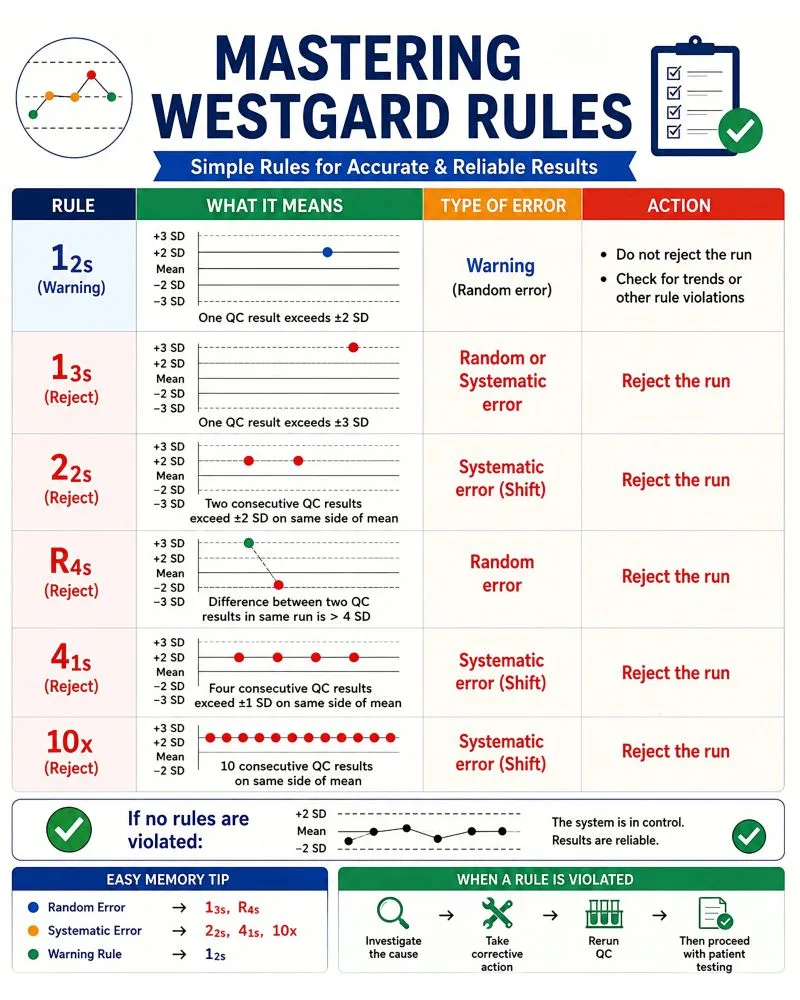
Westgard Rules: Principles of Internal Quality Control
The Westgard Rules are a set of statistical quality control (QC) rules used by medical laboratories to monitor analytical performance and identify potential errors in laboratory testing.
Developed from statistical quality control principles associated with Dr. James O. Westgard, these rules help laboratories evaluate internal quality control (IQC) results and determine whether an analytical run should be accepted or rejected.
By monitoring QC results against established statistical limits, laboratories can identify random error, systematic error, shifts, trends, and excessive analytical variation before patient results are released.
Key principle: When a QC rejection rule is violated, patient results should not be released until the problem has been investigated, corrective action has been taken, and acceptable QC performance has been demonstrated.
Why Are Westgard Rules Important?
Laboratory test results are used to support diagnosis, treatment, monitoring, and clinical decision-making. Therefore, laboratories must have systems in place to detect analytical problems before inaccurate results reach patients.
Westgard Rules help laboratories answer an important question:
"Is the analytical system performing well enough for patient results to be reported?"
They are applied to internal QC results and are commonly interpreted using a Levey–Jennings chart.
The rules can help identify:
- Random analytical error
- Systematic analytical error
- Shifts in analytical performance
- Trends in QC results
- Excessive imprecision
- Calibration problems
- Reagent deterioration or problems
- Instrument-related problems
- Control material problems
Understanding the Basics
Mean
The mean represents the expected average value of the QC material under stable analytical conditions.
For example, if a control has an assigned mean glucose concentration of 100 mg/dL, QC results should generally cluster around this value.
Standard Deviation (SD)
The standard deviation describes the amount of variation around the mean.
QC limits are commonly represented as:
- ±1 SD
- ±2 SD
- ±3 SD
The further a QC result moves from the mean, the more unusual the result becomes.
Levey–Jennings Chart
A Levey–Jennings chart is commonly used to plot QC results over time.
The chart contains:
- The mean
- +1 SD and -1 SD
- +2 SD and -2 SD
- +3 SD and -3 SD
The position and pattern of QC results on the chart help the laboratory identify potential QC rule violations.
The Westgard Rules
The commonly taught multirule QC system includes:
| Rule | Interpretation | Action | Common Error |
|---|---|---|---|
| 1₂s | One QC result exceeds ±2 SD | Warning | — |
| 1₃s | One QC result exceeds ±3 SD | Reject | Random/Systematic |
| 2₂s | Two consecutive QC results exceed ±2 SD on the same side | Reject | Systematic |
| R₄s | Two QC results in the same run differ by more than 4 SD | Reject | Random |
| 4₁s | Four consecutive QC results exceed ±1 SD on the same side | Reject | Systematic |
| 10x | Ten consecutive QC results fall on the same side of the mean | Reject | Systematic |
1₂s Rule — Warning Rule
Definition
The 1₂s rule is violated when one QC result exceeds ±2 SD from the mean.
For example:
- One QC result is above +2 SD
- OR one QC result is below -2 SD
Action
The 1₂s rule is generally considered a warning rule rather than an automatic rejection rule when used as part of a multirule QC procedure.
The laboratory should:
- Examine the QC result.
- Check other QC levels.
- Review previous QC results.
- Look for additional Westgard rule violations.
- Investigate possible trends or shifts.
A single 1₂s violation does not automatically mean that the analytical run must be rejected when the laboratory is using the traditional multirule approach.
Memory Tip
1₂s = Warning
1₃s Rule — Rejection Rule
Definition
The 1₃s rule is violated when one QC result exceeds ±3 SD from the mean.
This may occur when:
- One result is greater than +3 SD
- OR one result is less than -3 SD
Interpretation
A 1₃s violation indicates that the QC result is unusually far from the expected mean.
It may indicate:
- Random error
- Systematic error
- Instrument problems
- Reagent problems
- Calibration problems
- Control material problems
Action
Reject the analytical run.
Investigate the cause before patient results are released.
Memory Tip
1₃s = One result beyond 3 SD = Reject
2₂s Rule — Rejection Rule
Definition
The 2₂s rule is violated when two consecutive QC results exceed ±2 SD on the same side of the mean.
For example:
- QC result 1 = +2.2 SD
- QC result 2 = +2.4 SD
Both results are above +2 SD.
The same principle applies when both results are below -2 SD.
Interpretation
The pattern suggests a systematic error because the QC results are consistently displaced in the same direction.
Possible causes include:
- Calibration error
- Reagent deterioration
- Incorrect reagent preparation
- Instrument bias
- Incorrect calibration factor
Action
Reject the analytical run and investigate the cause.
Memory Tip
2₂s = Two results beyond 2 SD on the same side
R₄s Rule — Rejection Rule
Definition
The R₄s rule is violated when the difference between two QC results within the same analytical run is greater than 4 SD.
For example:
- Level 1 QC = +2.1 SD
- Level 2 QC = -2.3 SD
The difference is:
2.1 - (-2.3) = 4.4 SD
Therefore, the R₄s rule is violated.
Interpretation
R₄s is primarily associated with random error because there is excessive variation between QC measurements.
Possible causes include:
- Pipetting variation
- Air bubbles
- Instrument instability
- Intermittent analytical problems
- Poor mixing
- Control material handling problems
Action
Reject the analytical run and investigate the cause.
Memory Tip
R₄s = Range greater than 4 SD
4₁s Rule — Rejection Rule
Definition
The 4₁s rule is violated when four consecutive QC results exceed ±1 SD on the same side of the mean.
For example:
- +1.2 SD
- +1.4 SD
- +1.1 SD
- +1.6 SD
All four results are above +1 SD.
Interpretation
This pattern suggests systematic error.
The analytical system may have developed a consistent bias.
Possible causes include:
- Calibration problems
- Reagent deterioration
- Instrument bias
- Incorrect calibration
- Environmental changes
Action
Reject the analytical run and investigate the source of the systematic error.
Memory Tip
4₁s = Four consecutive results beyond 1 SD on the same side
10x Rule — Rejection Rule
Definition
The 10x rule is violated when ten consecutive QC results fall on the same side of the mean.
The results do not necessarily need to exceed ±1 SD. The important feature is that all ten results are on the same side of the mean.
Interpretation
This pattern suggests a persistent systematic bias or shift in analytical performance.
For example, ten consecutive QC results may all fall slightly above the mean.
Although each individual result may appear acceptable, the overall pattern suggests that the analytical system may no longer be centered around its expected mean.
Action
Reject the analytical run according to the laboratory's established QC procedure and investigate the cause.
Memory Tip
10x = Ten consecutive results on one side of the mean
Random Error vs Systematic Error
Understanding the difference between random and systematic error makes the Westgard Rules easier to remember.
Random Error
Random error produces unpredictable variation.
It can cause QC results to move in different directions and may appear as isolated outliers or excessive differences between control measurements.
Commonly associated rules:
- 1₃s
- R₄s
Possible causes:
- Pipetting variation
- Bubbles
- Intermittent instrument problems
- Poor mixing
- Control handling problems
Systematic Error
Systematic error produces a consistent deviation from the expected value.
It may appear as a shift or trend in QC results.
Commonly associated rules:
- 2₂s
- 4₁s
- 10x
Possible causes:
- Calibration error
- Reagent deterioration
- Instrument bias
- Incorrect reagent preparation
- Environmental changes
Shift vs Trend
Shift
A shift occurs when QC results suddenly move to a new level and remain there.
Example:
Before:  QC results fluctuate around the mean

After:   QC results consistently remain above the mean
A shift may indicate a sudden change in the analytical system, such as:
New reagent lot
Calibration change
Instrument maintenance
New calibration material
Trend
A trend occurs when QC results gradually move in one direction over time.
For example:
-0.2 SD
+0.1 SD
+0.4 SD
+0.8 SD
+1.2 SD
+1.6 SD
A trend may indicate gradual deterioration, such as:
Reagent deterioration
Progressive instrument problems
Calibration drift
Environmental changes
Quick Westgard Rules Reference
Rule What to Look For Decision
1₂s One result beyond ±2 SD Warning
1₃s One result beyond ±3 SD Reject
2₂s Two consecutive results beyond ±2 SD on same side Reject
R₄s Two results differ by >4 SD Reject
4₁s Four consecutive results beyond ±1 SD on same side Reject
10x Ten consecutive results on same side of mean Reject
Easy Memory Guide
Warning Rule
1₂s
One result exceeds 2 SD.
Random Error
1₃s + R₄s
Think:
"One far out or two far apart."
Systematic Error
2₂s + 4₁s + 10x
Think:
"Repeated results moving in the same direction."
What Should You Do When a QC Rule Is Violated?
When a rejection rule is violated:
- Stop and assess the QC results
Review all available QC levels and recent QC performance.
- Identify the rule that was violated
Determine whether the pattern suggests random or systematic error.
- Investigate the possible cause
Check:
Reagents
Calibration
Instrument performance
Control material
Pipetting
Environmental conditions
Recent maintenance
Lot changes
- Take corrective action
Correct the identified problem before continuing patient testing.
- Repeat QC
Run the appropriate QC material again.
- Confirm acceptable QC performance
Ensure that QC results meet the laboratory's acceptance criteria.
- Proceed with patient testing
Only after acceptable analytical performance has been established should patient testing continue.
Never release patient results simply because the patient sample results appear plausible when a QC rejection rule has been violated.
Important Note
Westgard Rules are a quality control decision-making framework, not a substitute for the laboratory's validated QC procedure.
Individual laboratories may use different combinations of rules depending on:
Test methodology
Analytical performance specifications
Number of QC levels
Frequency of QC testing
Instrument characteristics
Laboratory policy
Regulatory and accreditation requirements
Laboratories should follow their validated SOPs and applicable regulatory or accreditation requirements.
Practice Yourself
Test your understanding by examining QC patterns and identifying:
Which Westgard Rule has been violated?
Is the pattern more consistent with random or systematic error?
Should the analytical run be accepted or rejected?
What should the laboratory investigate?
Try the interactive Westgard QC challenges on LabGOTO.
Key Takeaway
Westgard Rules provide a structured way to identify potentially unacceptable analytical performance using internal QC data.
Remember:
1₂s → Warning
1₃s → Reject
2₂s → Reject / Systematic
R₄s → Reject / Random
4₁s → Reject / Systematic
10x → Reject / Systematic
The ultimate objective is simple:
Detect analytical problems before inaccurate laboratory results reach the patient.